class: center, middle, inverse, title-slide # Recoding variables and transformations ### Dr. Çetinkaya-Rundel ### October 3, 2017 --- --- class: center, middle # Paris Paintings --- ## Paintings in Paris - 1764-1780 - Dataset compiled by Sandra van Ginhoven and Hilary Coe Cronheim, students (now graduates) of DALMI (Duke Art, Law, and Markets Initiative). - Source: printed catalogues of 28 auction sales in Paris, 1764-1780 - 3,393 paintings: their prices & descriptive details from sales catalogues - 60 variables (fields) --- ## Auction sales in 2014 <center> <iframe width="900" height="417" src="https://www.youtube.com/embed/apaE1Q7r4so" frameborder="0" allowfullscreen data-autoplay></iframe> </center> --- ## Auction sales in 18th century Paris <img src="img/10/Carnavalet_Demachy_hotel_Bullion.jpg" alt="Pierre-Antoine de Machy, Public Sale at the Hôtel Bullion, Musée Carnavalet, Paris" style="width:800px;height:400px;"> Pierre-Antoine de Machy, Public Sale at the Hôtel Bullion, Musée Carnavalet, Paris Image credit: [Wikimedia Commons](https://upload.wikimedia.org/wikipedia/commons/7/75/P1140608_Carnavalet_Demachy_hotel_Bullion_rwk.jpg) --- ## Estimated total sales over years 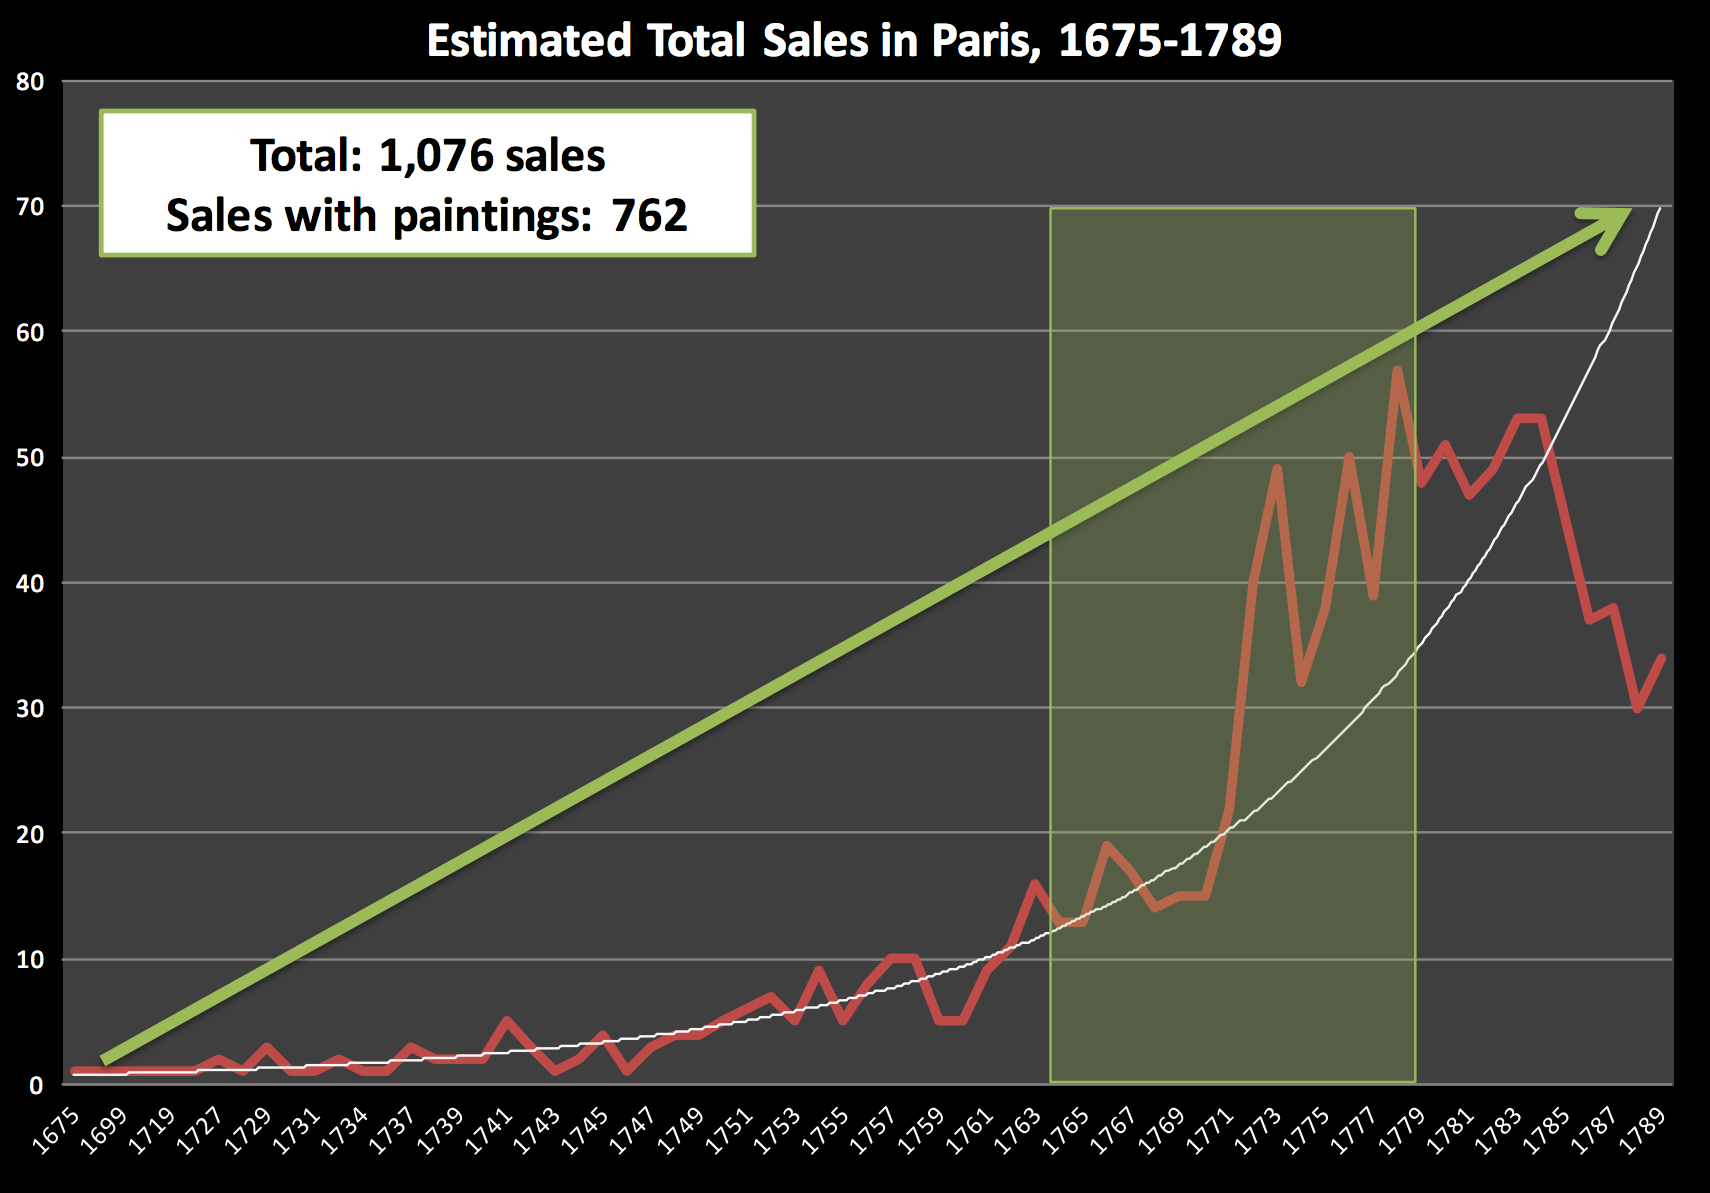 --- ## Total sales by dealers 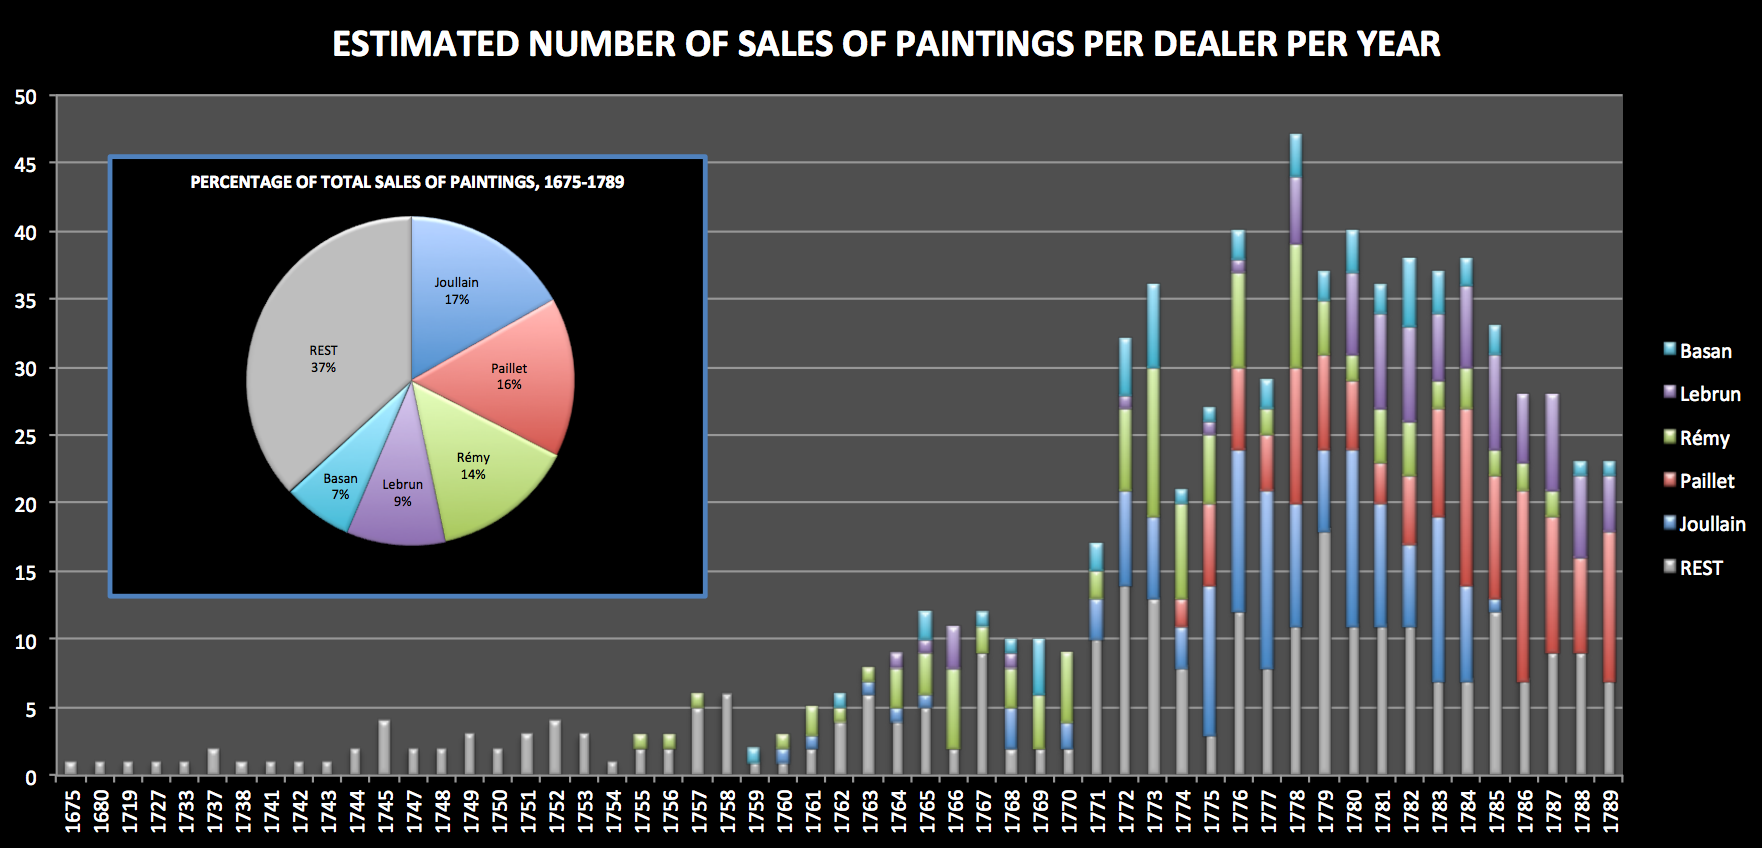 --- ## Source: Sales catalogues <center> 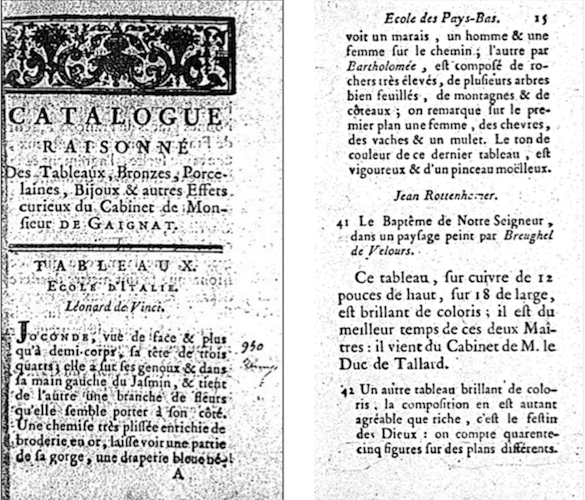 <center> --- ## Ex: The Departure of a Hunting Party Philip Wouwermans(1619-1668), oil on panel, 52 x 67 cm. <center> 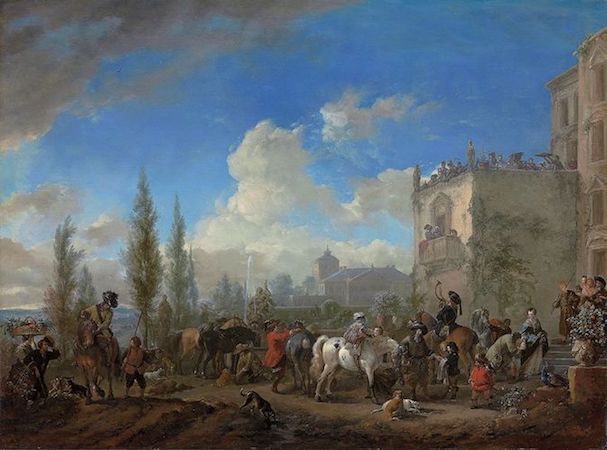 <center> --- ## Catalogue, then and now 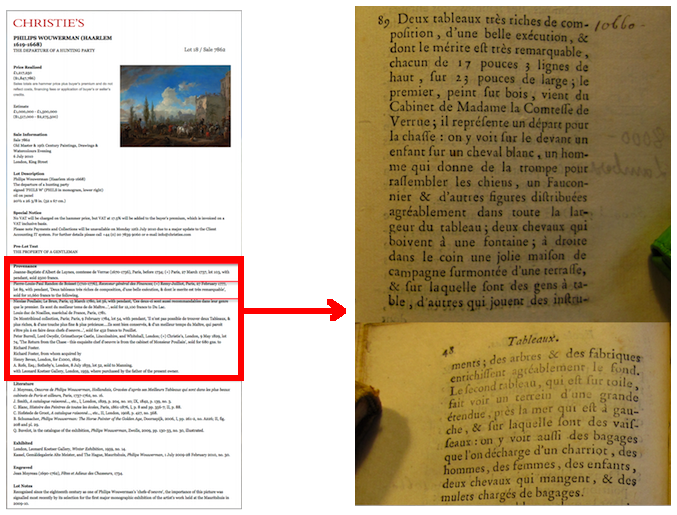 --- ## Catalogue description > Two paintings very rich in composition, of a beautiful execution, and whose merit is very remarkable, each 17 inches 3 lines high, 23 inches wide the first, painted on wood, comes from the Cabinet of Madame the Countess of Verrue; it represents a departure for the hunt: it shows in the front a child on a white horse, a man who sounds the horn to gather the dogs, a falconer and other figure nicely distributed across the width of the painting: two horses drinking from a fountain; on the right in the corner a lovely country house topped by a terrace, on which people are at the table, others who play instruments; trees and buildings pleasantly enrich the background. --- ## Dataset: Basic info on paintings 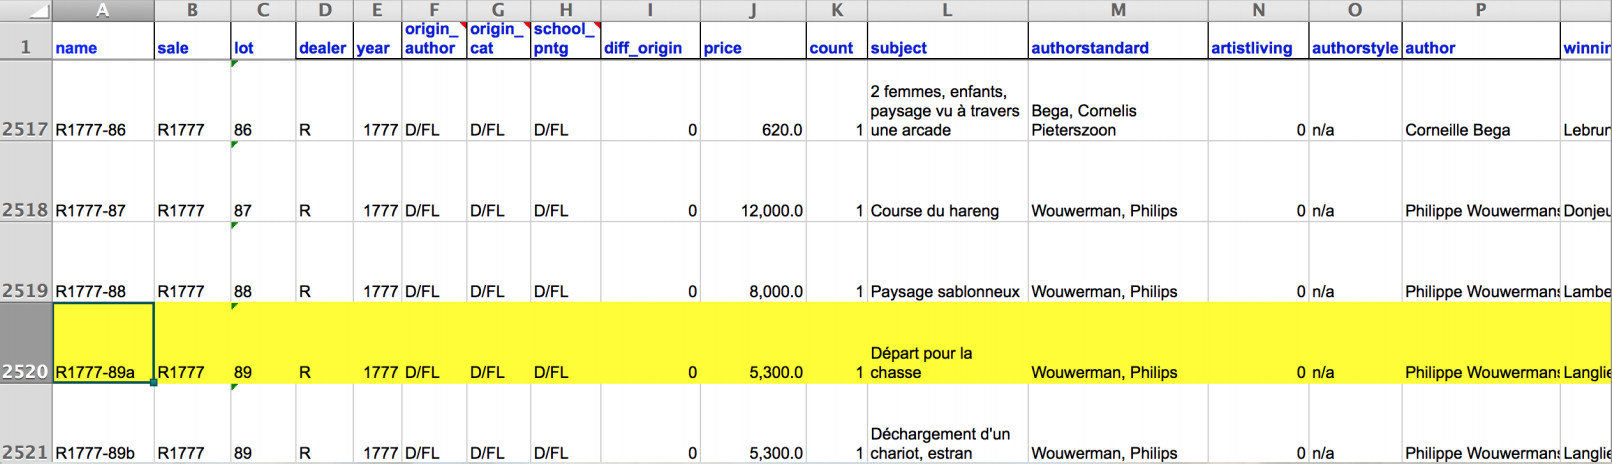 .small[ varible | description ---------------|----------------------------------------------------------- name | unique identifier of painting dealer | dealer initials (4 unique dealers: J, L, P, R) year | year of sale origin_author | origin of painting based on nationality of artist (A = Austrian, D/FL = Dutch/Flemish, F = French, G = German, I = Italian, S = Spanish, X = Unknown) origin_cat | origin of painting based on dealers’ classification in the catalogue (D/FL = Dutch/Flemish, F = French, I = Italian, O = Other, S = Spanish) ] --- ## Dataset: Basic info on paintings (cont.)  .small[ varible | description ---------------|----------------------------------------------------------- school_pntg | school of painting (A = Austrian, D/FL = Dutch/Flemish, F = French, G = German, I = Italian, S = Spanish, X = Unknown) diff_origin | if origin_author is different than origin_cat (0/1) price | price fetched at auction (sales price in livres) authorstandard | name of artist (standardized) artistliving | if artist is living or deceased at time of the sale (1 = yes, 0 = no) authorstyle | indicates how, if at all, the authors name is introduced, e.g. school of, copy after, in the manner of etc. or n/a if there is no introduction ] --- ## Dataset: Codebook Click [here](https://www2.stat.duke.edu/courses/Fall15/sta112.01/data/paris_paintings.html) for the full codebook. --- ## Exploratory questions - What are some important features of the distribution of the prices of paintings sold? - Describe the distribution of schools of paintings? - Are the paintings sold mostly by living artists? - How do prices vary over time and by school of painting? - Is a particular type of buyer more represented than other? - Could we think of any way to categorize the paintings from high- to low-end? What could be some criteria that help us construct his categorization? --- ## Load data ```r library(tidyverse) # ggplot2 + dplyr + readr + and some others library(stringr) ``` ```r pp <- read_csv("data/paris_paintings.csv", na = c("n/a", "", "NA")) ``` --- class: center, middle # Recoding variables --- ## Shapes of paintings ```r pp %>% group_by(Shape) %>% summarise(count = n()) %>% arrange() ``` ``` ## # A tibble: 9 x 2 ## Shape count ## <chr> <int> ## 1 miniature 10 ## 2 octagon 1 ## 3 octogon 1 ## 4 oval 28 ## 5 ovale 24 ## 6 ronde 5 ## 7 round 69 ## 8 squ_rect 3219 ## 9 <NA> 36 ``` --- ## Recode scheme | original | new | change? | |:-----------|:------------|:------------| | `miniature`| `miniature` | no | | `octagon`| `octagon` | no | | `octogon`| `octagon` | yes | | `oval`| `oval` | no | | `ovale`| `oval` | yes | | `squ_rect`| `squ_rect` | no | | `ronde`| `round` | yes | | `round`| `round` | no | --- ## Recoding shape of painting Create new variable `shape_recode`: ```r pp <- pp %>% mutate(shape_recode = case_when( Shape == "ovale" ~ "oval", Shape == "ronde" ~ "round", Shape == "octogon" ~ "octagon", # otherwise leave as original Shape TRUE ~ Shape )) ``` --- ## Check before you move on! ```r pp %>% count(shape_recode, Shape) %>% arrange(shape_recode) ``` ``` ## # A tibble: 9 x 3 ## shape_recode Shape n ## <chr> <chr> <int> ## 1 miniature miniature 10 ## 2 octagon octagon 1 ## 3 octagon octogon 1 ## 4 oval oval 28 ## 5 oval ovale 24 ## 6 round ronde 5 ## 7 round round 69 ## 8 squ_rect squ_rect 3219 ## 9 <NA> <NA> 36 ``` --- ## Check before you move on! ```r pp %>% count(shape_recode) ``` ``` ## # A tibble: 6 x 2 ## shape_recode n ## <chr> <int> ## 1 miniature 10 ## 2 octagon 2 ## 3 oval 52 ## 4 round 74 ## 5 squ_rect 3219 ## 6 <NA> 36 ``` --- ## Converting numerical to categorical - If `nfigures` == 0 `\(\rightarrow\)` `fig_mention` = `no figures` - If `nfigures` >= 1 `\(\rightarrow\)` `fig_mention` = `some figures` ```r pp <- pp %>% mutate(fig_mention = ifelse(nfigures == 0, "no figures", "some figures")) ``` --- ## Check before you move on! ```r pp %>% count(fig_mention, nfigures) ``` ``` ## # A tibble: 46 x 3 ## fig_mention nfigures n ## <chr> <int> <int> ## 1 no figures 0 3181 ## 2 some figures 2 6 ## 3 some figures 3 10 ## 4 some figures 4 18 ## 5 some figures 5 16 ## 6 some figures 6 4 ## 7 some figures 7 11 ## 8 some figures 8 11 ## 9 some figures 9 17 ## 10 some figures 10 8 ## # ... with 36 more rows ``` --- ## More than one way to... <div class="question"> What other function could we use for this? How would you do this using that function? </div> ```r pp <- pp %>% mutate(fig_mention = ifelse(nfigures == 0, "no figures", "some figures")) ``` --- ## Recoding, kicked up a notch... Let's tackle the `mat` variable: ```r pp %>% count(mat) ``` ``` ## # A tibble: 20 x 2 ## mat n ## <chr> <int> ## 1 a 2 ## 2 al 1 ## 3 ar 1 ## 4 b 886 ## 5 br 7 ## 6 c 312 ## 7 ca 3 ## 8 co 6 ## 9 e 1 ## 10 g 3 ## 11 h 22 ## 12 m 1 ## 13 mi 7 ## 14 o 4 ## 15 p 35 ## 16 pa 8 ## 17 t 1689 ## 18 ta 88 ## 19 v 11 ## 20 <NA> 306 ``` --- ## Recoding scheme .small[ mat | explanation | new categories | mat | explanation | new categories ----|:----------------------|:----------------|:-----|:----------------------|:--------------- `a` | silver | `metal` | `h` | oil technique | uncertain `al`| alabaster | `stone` | `m` | marble | stone `ar`| slate | `stone` | `mi` | miniature technique | uncertain `b` | wood | `wood` | `o` | other | other `bc`| wood and copper | `metal` | `p` | paper | paper `br`| bronze frames | `uncertain` | `pa` | pastel | uncertain `bt`| canvas on wood | `canvas` | `t` | canvas | canvas `c` | copper | `metal` | `ta` | canvas? | uncertain `ca`| cardboard | `paper` | `v` | glass | other `co`| cloth | `canvas` | `g` | grissaille technique | uncertain `e` | wax | `other` | ] --- ## Making use of the `%in%` operator Create new variable `mat_recode`: ```r pp <- pp %>% mutate(mat_recode = case_when( mat %in% c("a", "bc", "c") ~ "metal", mat %in% c("al", "ar", "m") ~ "stone", mat %in% c("al", "ar", "m") ~ "stone", mat %in% c("co", "bt", "t") ~ "canvas", mat %in% c("p", "ca") ~ "paper", mat == "b" ~ "wood", mat %in% c("o", "e", "v") ~ "other", TRUE ~ "uncertain" )) ``` --- ## Check before you move on! ```r pp %>% count(mat_recode) %>% arrange(desc(n)) ``` ``` ## # A tibble: 7 x 2 ## mat_recode n ## <chr> <int> ## 1 canvas 1695 ## 2 wood 886 ## 3 uncertain 441 ## 4 metal 314 ## 5 paper 38 ## 6 other 16 ## 7 stone 3 ``` --- class: center, middle # Transformations --- ## Price vs. surface <div class="question"> Describe the relationship between price and width of painting. </div> ```r ggplot(data = pp, aes(x = Width_in, y = price)) + geom_point(alpha = 0.5) + labs(title = "Price vs. width") ``` ``` ## Warning: Removed 256 rows containing missing values (geom_point). ``` 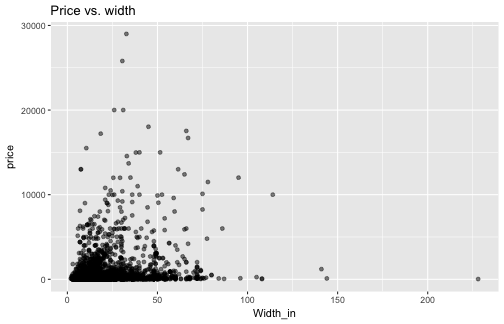<!-- --> --- ## Let's focus on small-ish paintings ```r pp_wt_lt_100 <- pp %>% filter(Width_in < 100) ``` --- ## Price of small-ish paintings ```r ggplot(data = pp_wt_lt_100, aes(x = price)) + geom_histogram(binwidth = 500) + labs(title = "Small-ish paintings, price") ``` 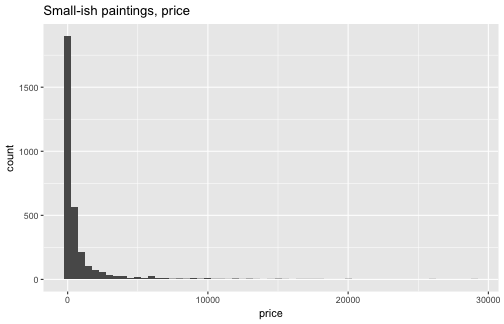<!-- --> --- ## Log(price) of small-ish paintings ```r ggplot(data = pp_wt_lt_100, aes(x = log(price))) + geom_histogram(binwidth = 0.5) + labs(title = "Small-ish paintings, log(price)") ``` <!-- --> --- ## Log(price) paintings vs. width ```r ggplot(data = pp_wt_lt_100, aes(x = Width_in, y = log(price))) + geom_point(alpha = 0.5) + labs(title = "Small-ish paintings, log(price) vs. width") ``` <!-- -->