| Budidng Yeast data can be downloaded here, which includes 120 images. The corresponding project file can be downloaded here. |
Step 1: Preprocessing Action: The images are first loaded into CellTracer and then zoomed in to focus mainly on cell clusters. It is then cropped using the "Crop images to current view" tool in "Edit" menu. Purpose: Cropping will generally reduce the size of input images thus reduce the image analysis processing time. Paramenters: None. Result: All cropped images can be found here. As an example, the preprocessed result for image 120 is showing bellow.  |
Step 2: Background screening Action: Applying the Range Filtering algorithm to identify the background region. Purpose: To identify an initial backgroung region mask. Paramenters:
The CellTracer snapshot file for this step can be found here. A screen shot for this step is shown below.  |
Step 3: Identifying Border Regions Action: Applying the Minimum Ranking algorithm to identify the cell border regions. Purpose: To identify the bright regions that surround cells Paramenters:
The CellTracer snapshot file for this step can be found here. A screen shot for this step is shown below.  |
Step 4: Identifying Border Regions(again) Action: Applying the Rank & Count Transform algorithm to further identify the cell border regions. Paramenters:
The CellTracer snapshot file for this step can be found here. A screen shot for this step is shown below. 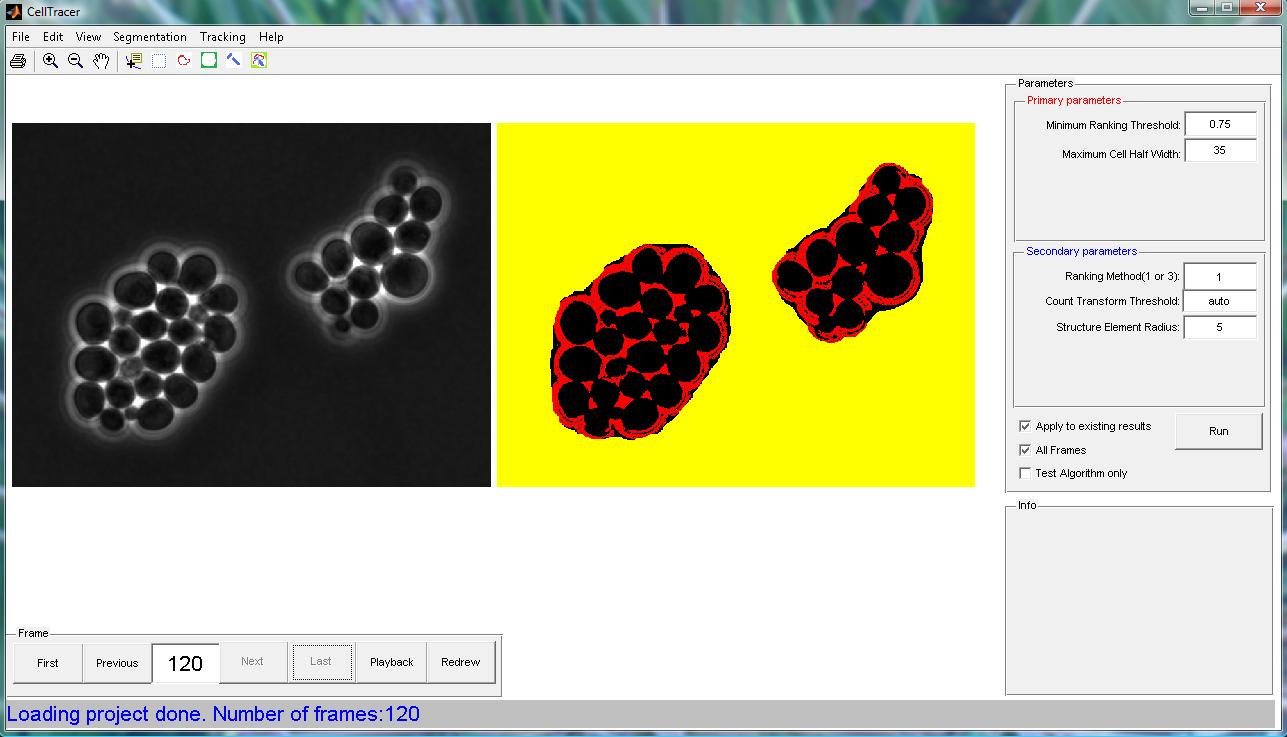 |
Step 5: Identifying Cells Action: Applying the Convex Model algorithm to identify cells. Paramenters:
The CellTracer snapshot file for this step can be found here. A screen shot for this step is shown below.  |
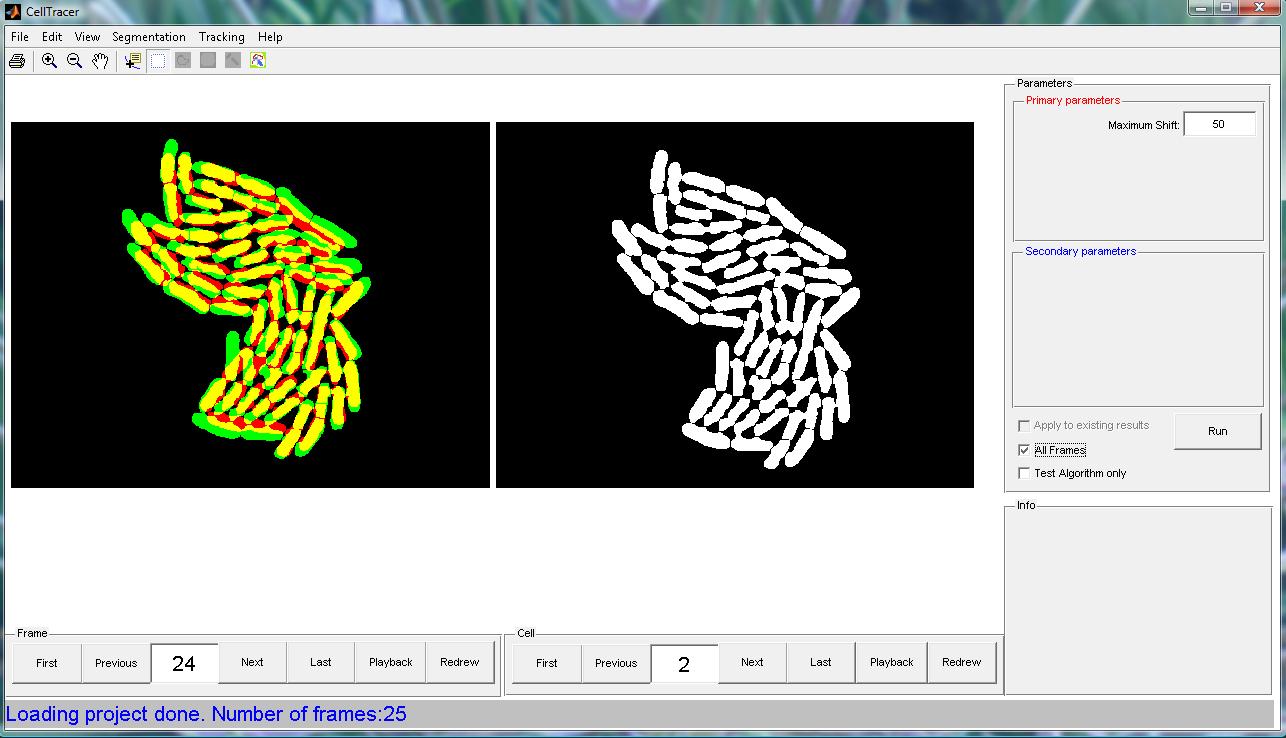
Step 6: Global Alignment Action: Applying the Global Alignment algorithm to algin images before tracking. Paramenters:
The CellTracer snapshot file for this step can be found here. A screen shot for this step is shown below.  |
Step 7: Cell Tracking Action: Applying the Cell Tracking algorithm. Paramenters:
The CellTracer snapshot file for this step can be found here. A screen shot for this step is shown below.  |