GraphExplore is a stand-alone Java environment for dynamically
displaying graphs of nodes and edges; it runs
on any operating system that has a Java virtual machine
installed. GraphExplore provides various displays of
nodes/vertices of a graph with undirected or directed edges, and a number of additional
features. Inputs are text files: a files with names/descriptors of the nodes of the graph,
a file defining the edges/arrows between nodes, and an optional "cluster" file
that identifies groups of nodes for colour coding.
GraphExplore is able to dynamically retrieve information about the objects in the
network from the internet. You can either specify a relevant URL for each
object or let GraphExplore query a relevant website
with key words identifying objects of interest. The program creates displays
using neato
from AT&Ts GraphViz open source graph drawing
software as well as modified versions of the layout libraries
available from Java Universal Network/Graph Framework (JUNG). Once a project is
loaded, you can modify and query the graph. The facilities include options to
query "linking" nodes, defines weights/relevances on edges, move nodes around, and
delete nodes. GraphExplore
dynamically displays information about the neighbours and links of nodes, generates edge
reports summarizing the information contained in an image, and save or print graphs.
In GraphExplore you can define various node colours and shapes
and assign different features to nodes in clusters. GraphExplore has
a range of other features to compare graphs, as well as a help file and tutorial.
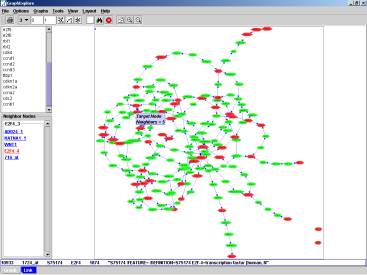
Figure
1. A graph representing gene expression
associations: nodes are genes and edges represent statistical associations
in an analysis of gene expression data in breast cancer tissues. Target genes
whose names were searched are shown in red, while linkers
between these genes are green.