| ASSESS ~ Analysis of Sample Set Enrichment Scores |
Examples |
Leukemia Example
Expression data | Classes | Gene sets | Scores | Heat map
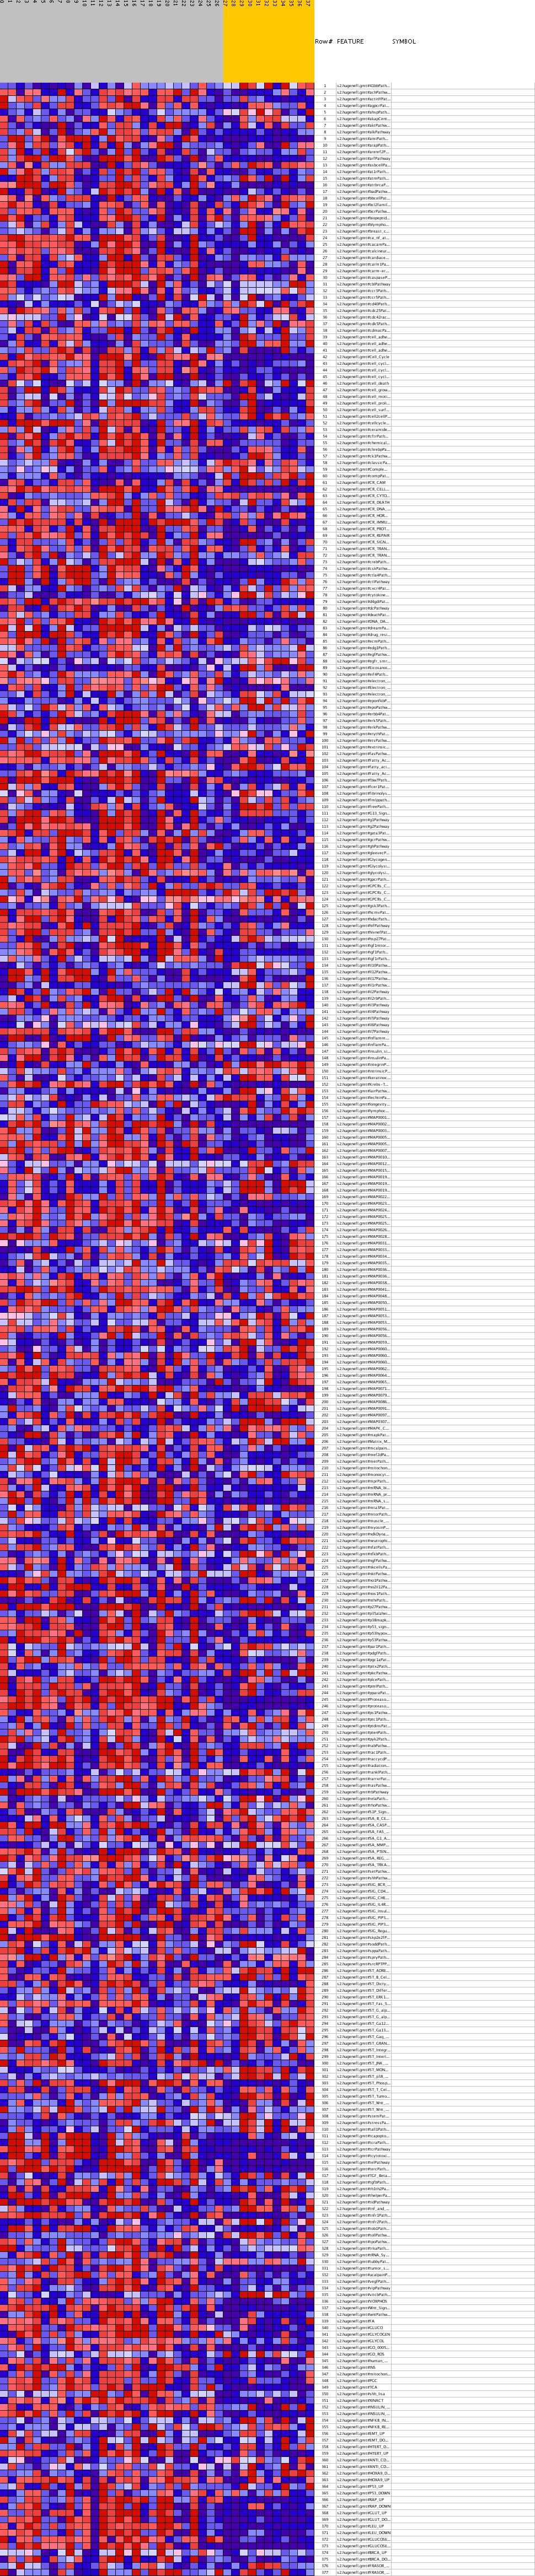
 A very natural consequence of obtaining enrichment scores for each sample in the data set is that classification
and clustering can now be preformed in the space of gene sets rather than individual genes. In this example,
ASSESS was applied to an expression data set with acute myelogenous leukemia (AML) and acute lymphoblastic
leukemia (ALL) samples on a database of 377 gene sets.
Enrichment scores can be found here and shown graphically
here.
A very natural consequence of obtaining enrichment scores for each sample in the data set is that classification
and clustering can now be preformed in the space of gene sets rather than individual genes. In this example,
ASSESS was applied to an expression data set with acute myelogenous leukemia (AML) and acute lymphoblastic
leukemia (ALL) samples on a database of 377 gene sets.
Enrichment scores can be found here and shown graphically
here.
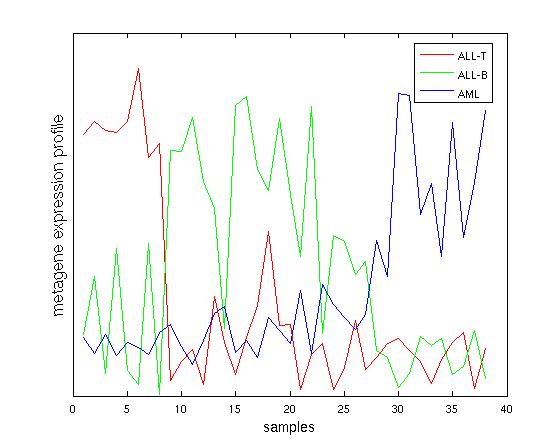
A matrix factorization method (NMF) was applied to this space of enrichment scores. With k=2, clustering obtained from the enrichment space accurately differentiated ALL from AML samples. Clustering with k=3 (see image on right) accurately selected three subsets of the samples: ALL-T, ALL-B, and AML all had greater confidence than that from the raw expression data.
Gender Example
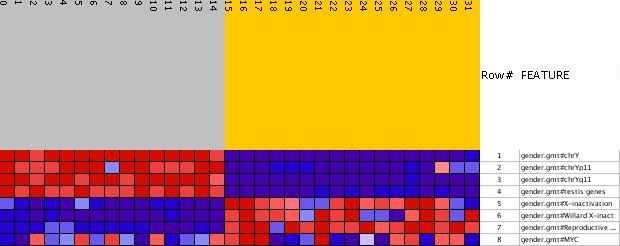
The enrichment scores from affymetrix gene expression data with probes from 22,283 human genes with gender
labels was computed in 8 gene sets. Gene sets were defined by cytogenetic bands and pathway or functional
properties. As expected for males chromosome Y as well as its two bands (Yp11 and Yq11) and the gene set
corresponding to genes enriched in male reproductive tissue (testis) were over expressed.
For females two gene sets of genes that escape X-inactivation were over expressed in addition
to a gene set corresponding to genes enriched in female reproductive tissue (uterus).
The Myc gene set was used as a control in that it is not expected to be enriched with respect
to the male/female distinction and indeed this is the case. The heatmap (see picture below) produced by ASSESS are provided here.