class: center, middle, inverse, title-slide # Bootstrap Estimation ### Yue Jiang ### Duke University --- class: center, middle # Inference --- ## Terminology .vocab[Population]: a group of individuals or objects we are interested in studying .vocab[Parameter]: a numerical quantity derived from the population (almost always unknown) If we had data from every unit in the population, we could just calculate population parameters and be done! -- **Unfortunately, we usually cannot do this.** .vocab[Sample]: a subset of our population of interest .vocab[Statistic]: a numerical quantity derived from a sample If the sample is .vocab[representative], then we can use the tools of probability and statistical inference to make .vocab[generalizable] conclusions to the broader population of interest. --- ## Statistical inference .vocab[Statistical inference] is the process of using sample data to make conclusions about the underlying population the sample came from. - .vocab[Estimation]: estimating an unknown parameter based on values from the sample at hand - .vocab[Testing]: evaluating whether our observed sample provides evidence for or against some claim about the population Today we will focus on estimation. --- class: center, middle # Estimation --- ## You're going on vacation! .center[  **How much should we expect to pay for an Airbnb in Asheville?** ] --- ## Asheville data [Inside Airbnb](http://insideairbnb.com/) scraped all Airbnb listings in Asheville, NC, that were active on June 25, 2020. **Population of interest**: listings in the Asheville with at least ten reviews. **Parameter of interest**: Mean price per guest per night among these listings. .question[ What is the mean price per guest per night among Airbnb rentals in June 2020, among Airbnbs with at least ten reviews in ZIP codes 28801 - 28806? ] The dataset `asheville.csv` contains the price per guest (`ppg`) for a random sample of 50 listings. --- ## Point estimate A point estimate is a single value computed from the sample data to serve as the "best guess", or estimate, for the population parameter. Let's use the sample mean from our dataset in order to do so. ```r library(tidyverse) abb <- read_csv("data/asheville.csv") abb %>% summarize(mean_price = mean(ppg)) ``` ``` ## # A tibble: 1 x 1 ## mean_price ## <dbl> ## 1 76.6 ``` .question[ Is this enough? Are we done? Is there any more insight that can be gained? ] --- ## Visualizing our sample <!-- --> --- ## Confidence intervals A plausible range of values for the population parameter is an .vocab[interval estimate]. One type of interval estimate is known as a .vocab[confidence interval]. .pull-left[  ] .pull-right[  ] - If we report a point estimate, we probably won't hit the exact population parameter. - If we report a range of plausible values, we have a good shot at capturing the parameter inside it (even if we don't know exactly where it is). --- ## Variability of sample statistics For a confidence interval for the population mean, we need to come up with a range of plausible values around our observed sample mean. - Remember that random samples may differ from each other. If we took another random sample of 50 Airbnb listings, we probably wouldn't get the same mean price per guest. - There is some .vocab[variability] of the sample mean from these listings. - To construct a confidence interval, we need to quantify this variability. This gives us a measurement of how much we expect the sample mean to vary from sample to sample. -- .question[ Suppose we took another random sample of 50 listings. What might you expect the mean price per guest to be? Would you be surprised if it was $80? What about $120? Or $800? ] --- ## Quantifying the variability We can quantify the variability of sample statistics using different approaches: - **Simulation**: via bootstrapping or "resampling" techniques - **Theory**: via the Central Limit Theorem **We will focus on simulation methods today** --- class: center, middle # Bootstrapping --- ## The bootstrap principle The term bootstrapping comes from the phrase "pulling oneself up by one’s bootstraps", to help oneself without the aid of others. In this case, we are estimating a population parameter, and we’ll accomplish it using data from **only from the given sample**. This notion of saying something about a population parameter using only information from an observed sample is the crux of statistical inference, it is not limited to bootstrapping. *"The population is to the sample as the sample is to the bootstrap sample"* – Fox, 2008 --- ## The bootstrap procedure 1. Take a .vocab[bootstrap sample]: a random sample taken **with replacement** from the original sample, **of the same size** as the original sample. 2. Calculate the bootstrap statistic: the statistic you’re interested in (the mean, the median, the correlation, etc.) computed on the bootstrap sample. 3. Repeat steps 1 and 2 many times to create a .vocab[bootstrap distribution]. 4. Calculate the bounds of a confidence interval using the bootstrap distribution. --- ## The original sample <br><br> <!-- --> --- ## Step-by-step **Step 1.** Take a .vocab[bootstrap sample]: a random sample taken **with replacement** from the original sample, **of the same size** as the original sample: <!-- --> --- ## Step-by-step **Step 2.** Calculate the bootstrap statistic (in this case, the sample mean) using the bootstrap sample: <!-- --> --- ## Step-by-step **Step 3.** Do steps 1 and 2 over and over again to create a bootstrap distribution of sample means: .pull-left[ <!-- --> <!-- --> ] .pull-right[ <!-- --> <!-- --> ] --- ## Step-by-step **Step 3.** In this plot, we've taken 500 bootstrap samples, calculated the sample mean for each, and plotted them in a histogram: <!-- --> --- ## Step-by-step **Step 3.** Here we compare the bootstrap distribution of sample means to that of the original data. What do you notice? <!-- --><!-- --> --- ## Step-by-step **Step 4.** Calculate the bounds of the bootstrap interval by using percentiles of the bootstrap distribution <!-- --> --- ## CI interpretation <!-- --> Using the 2.5th and 97.5th quantiles as bounds for our confidence interval gives us the middle 95% of the bootstrap means. Our 95% CI is (65.1, 89.4). .question[ Does this mean there is a 95% chance that the true mean price per night in the population is contained in the interval (65.1, 89.4)? ] --- class: center, middle # <span style="color:red">NO</span> --- ## Interpreting a confidence interval The population parameter is either in our interval or it isn't. It can't have a "95% chance" of being in any specific interval. The bootstrap distribution captures the variability of the sample mean, but is based on our original sample. If we obtained a different sample to begin with, (perhaps centered somewhere else), then maybe our estimated 95% confidence interval would have been different also. -- All we can say is that, if we were to independently take repeated samples from this population and calculate a 95% CI for the mean in the exact same way, then we would *expect* 95% of these intervals to truly cover the population mean. However, we never know if any particular interval(s) actually do! This is the meaning of .vocab[statistical confidence]. **Warning:** Be careful with the concepts of repeatedly **re-**sampling from the sample to obtain a bootstrap distribution vs. taking a new sample entirely. --- ## Interpretation visualization <!-- --> --- class: center, middle # Implementation in R --- ## Step-by-step **Step 1.** Take a .vocab[bootstrap sample]: a random sample taken **with replacement** from the original sample, **of the same size** as the original sample: ```r set.seed(1) indices <- sample(1:nrow(abb), 50, replace = T) boot_samp_1 <- abb %>% slice(indices) ``` **Step 2.** Calculate the bootstrap statistic (in this case, the sample mean) using the bootstrap sample: ```r boot_samp_1 %>% summarize(mean_price = mean(ppg)) ``` ``` ## # A tibble: 1 x 1 ## mean_price ## <dbl> ## 1 77.4 ``` --- ## Step-by-step **Step 3.** Do steps 1 and 2 over and over again to create a bootstrap distribution of sample means. ```r # wait...do we have to create boot_samp_2, boot_samp_3, boot_samp_4, ...?! ``` In R, we can use loops to automate repetitive tasks so we don't have to copy/paste code thousands of times. `for` loops are the most common type of loop in R. They iterate through the elements of a vector and evaluate what's contained inside its code block for each iteration. --- ## `for` loops ```r # Create empty data frame of size 500 *boot_dist = numeric(500) # For loop to populate this dataframe for(i in 1:500){ set.seed(i) indices <- sample(1:nrow(abb), replace = T) boot_mean <- abb %>% slice(indices) %>% # choose those indices summarize(boot_mean = mean(ppg)) %>% # calculate sample mean pull() # pull as vector, not dataframe boot_dist[i] <- boot_mean # set i-th element of boot_dist } ``` --- ## `for` loops ```r # Create empty data frame of size 500 boot_dist = numeric(500) # For loop to populate this dataframe *for(i in 1:500){ set.seed(i) indices <- sample(1:nrow(abb), replace = T) boot_mean <- abb %>% slice(indices) %>% # choose those indices summarize(boot_mean = mean(ppg)) %>% # calculate sample mean pull() # pull as vector, not dataframe boot_dist[i] <- boot_mean # set i-th element of boot_dist *} ``` --- ## `for` loops ```r # Create empty data frame of size 500 boot_dist = numeric(500) # For loop to populate this dataframe for(i in 1:500){ * set.seed(i) * indices <- sample(1:nrow(abb), replace = T) boot_mean <- abb %>% slice(indices) %>% # choose those indices summarize(boot_mean = mean(ppg)) %>% # calculate sample mean pull() # pull as vector, not dataframe boot_dist[i] <- boot_mean # set i-th element of boot_dist } ``` --- ## `for` loops ```r # Create empty data frame of size 500 boot_dist = numeric(500) # For loop to populate this dataframe for(i in 1:500){ set.seed(i) indices <- sample(1:nrow(abb), replace = T) * boot_mean <- abb %>% * slice(indices) %>% # choose those indices * summarize(boot_mean = mean(ppg)) %>% # calculate sample mean * pull() # pull as vector, not dataframe boot_dist[i] <- boot_mean # set i-th element of boot_dist } ``` --- ## `for` loops ```r # Create empty data frame of size 500 boot_dist = numeric(500) # For loop to populate this dataframe for(i in 1:500){ set.seed(i) indices <- sample(1:nrow(abb), replace = T) * boot_mean <- abb %>% * slice(indices) %>% # choose those indices * summarize(boot_mean = mean(ppg)) %>% # calculate sample mean * pull() # pull as vector, not dataframe * boot_dist[i] <- boot_mean # set i-th element of boot_dist } ``` --- ## Our bootstrap distribution ```r boot_means <- tibble(boot_dist) boot_means ``` ``` ## # A tibble: 500 x 1 ## boot_dist ## <dbl> ## 1 77.4 ## 2 87.5 ## 3 77.1 ## 4 72.1 ## 5 80.7 ## 6 87.8 ## 7 81.6 ## 8 88.0 ## 9 65.3 ## 10 81.3 ## # ... with 490 more rows ``` --- ## Calculate confidence bounds ```r boot_means %>% summarize(lower = quantile(boot_dist, 0.025), upper = quantile(boot_dist, 0.975)) ``` ``` ## # A tibble: 1 x 2 ## lower upper ## <dbl> <dbl> ## 1 65.1 89.4 ``` --- ## Visualize bootstrap sample means ```r ggplot(data = boot_means, aes(x = boot_dist)) + geom_histogram(binwidth = 5) + labs(title = "Bootstrap distribution of means", x = "Price per night", y = "Count") ``` 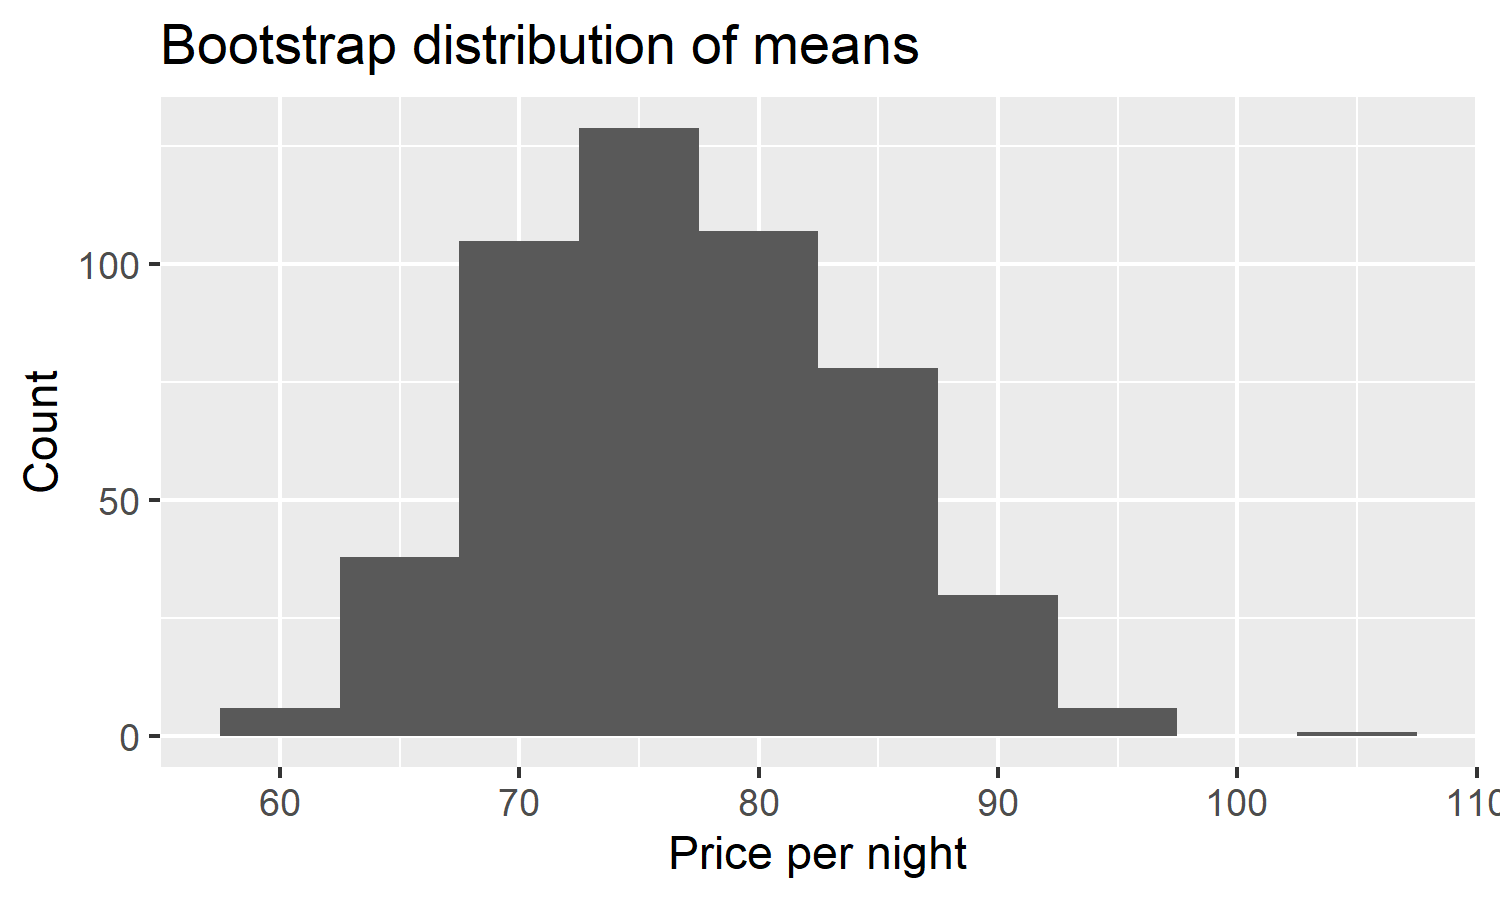<!-- --> --- ## Your turn! [https://classroom.github.com/a/EpLomp4N](https://classroom.github.com/a/EpLomp4N)