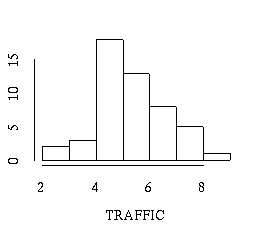
A histogram summarizes one-sample data by grouping the data into classes (2-3, 3-4 etc.), and plotting a bar for each class. The height of each bar corresponds to the frequency (i.e. number of observations) in the respective class. In minitab you can create histograms with the histo command.
 MTB > histo c1

 Histogram of C1   N = 49

 Midpoint   Count
      3.0       3  ***
      3.5       1  *
      4.0       3  ***
      4.5      13  *************
      5.0       6  ******
      5.5       9  *********
      6.0       5  *****
      6.5       2  **
      7.0       4  ****
      7.5       0
      8.0       2  **
      8.5       0
      9.0       1  *

 MTB >