STA 110B ``solutions'' STA 110B ``solutions'' Homework 13

13-8

  1. Note that df = 66-3-1 = 62 » 60, so t.025 = 2.

    X1

    95% CI = 0.021±2·0.019 = 0.021 ±0.38
    t-ratio = 0.021/0.019 = 1.105
    p-value > 2 ·0.1 = 0.2 (two-sided p-value)

    X2

    95% CI = 0.075±2·0.034 = 0.075 ±0.068
    t-ratio = 0.075/0.034 = 2.206
    p-value 2 ·0.010 - 2·0.025, ie, 0.02 - 0.05 (two-sided p-value)

    X3

    95% CI = 0.043±2·0.018 = 0.043 ±0.0.036
    t-ratio = 0.043/0.018 = 2.390
    p-value » 2 ·0.010 = 0.02 (two-sided p-value)

  2. We are assuming that the 66 students are a random sample for a hypothetical large population, which in this case in not so reasonable - they are very far from having been selected at random, they are just the available students at a certain time.

  3. The variable X3, because it has the largest t-ratio and smallest p-value.

  4. We should keep the first regressor first because there is enough statistical evidence to support that, and second because it is very reasonable to expect that a student's rank (from the bottom) is positively related with his/her score in a test.

13-11

  1. DY = b2 DX2 = -1.1 (5-2) = -3.3, therefore the answer should be less $3.3 per front foot.
  2. DY = b3 DX3 = -1.34 (-1/2) = 0.67, and we conclude that the price per front foot is $0.67 higher if the lot is 1/2 a mile closer to the nearest paved road (other things being equal).
  3. DY = b1 DX1 = 1.5 (5-1) = 6, so the price is $6 per front foot higher than in 1970. (Same kind of lot: size and distance from the nearest paved road.)

14-3

  1. df = 1072-5-1 = 1066 Þ t.025 » z.025 = 1.96

    AGE -3.9±1.96×1.8 = -3.9±3.53
    SMOK -9.0±1.96×2.2 = -9.0±4.31
    CHEMW -350±1.96×46 = -350±90.16
    FARMW -380±1.96×53 = -380±103.88
    FIREW -180±1.96×54 = -180±105.84

  2. age and amount of cigarettes per day; 9; lower.
  3. 30; higher.
  4. 39; lower.
  5. 20×9 = 180; lower.
  6. 180/39 » 4.6 years; important variables may be omited.

14-9

    1. DA = DB = 0, so [^Y] = 61.
    2. DA = 1, DB = 0, so [^Y] = 61+9 = 70.
    3. DA = 0, DB = 1, so [^Y] = 61+12 = 73.

  1. [`C] = answer i., [`A] = answer ii. and [`B] = answer iii..
  2. one factor ANOVA; ``Yield'' is the response, the factor is the type of fertilizer - A, B or none (C).

14-13

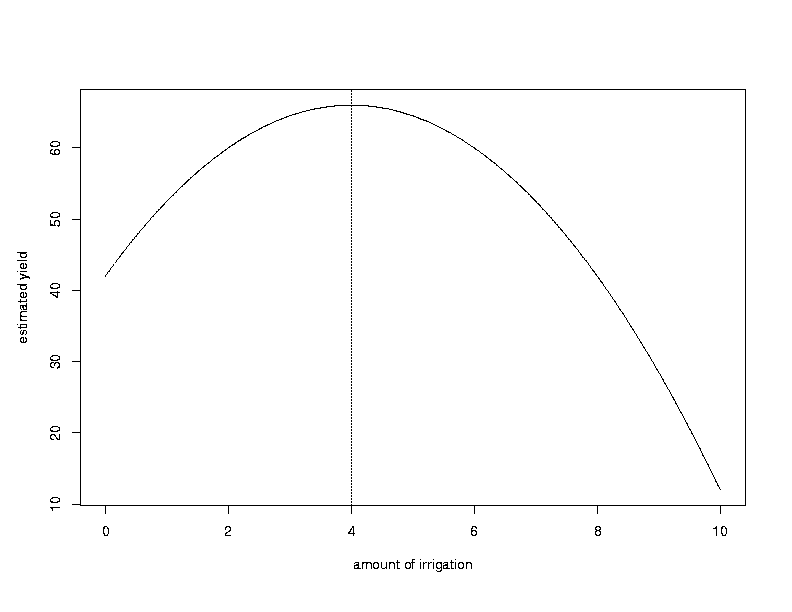
  1. Not very credible, since too much water should have a negative effect on the yield.
  2. We should test that the coefficient for I2 is zero. df = 14-2-1 = 11 and the t ratio is -1.5/.4 = -3.75 which implies that the p-value is between 2×.001 and 2× .0025, that is 0.002 < p-value < 0.005. This conveys very little evidence in support of this hypothesis, which confirms our previous answer.
  3. The maximum occurs at I = 4, but we can use less water without decreasing too much the yield.

  4. D[^Y] = 12·DI-1.5 ·DI2 = 12·(3-2) -1.5 ·(32-22) = 4.5

14-18

  1. elasticity = 1.3 (slope)
  2. relative change in price » change in log price, so if price increased by 3%, the price changed 0.03. Hence, DlogQ = 1.3 ×0.03 = 0.039 and, for the same reason, we conclude that Q increased by 3.9%
  3. relative change in Q of 10% » change in logQ of 0.1, so,
    0.1 = 1.3 DlogP Û DlogP = 0.1
    1.3
    = 0.007
    so that the relative change in price should be approximately 7.7%.


File translated from TEX by TTH, version 2.00.
On 24 Nov 1999, 11:34.