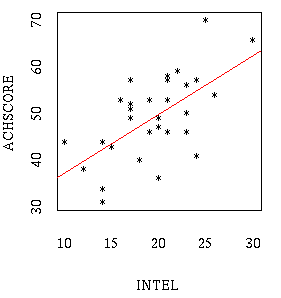
Simple Linear Regression

The lease-squares regression line gives the best linear (i.e. in the form
of a line y=a+bx ) fit for a scatterplot of correlation-
regression data (x1,y1),...,(xn,yn).
In Minitab you can compute intercept and slope of the regression line
using the regress command:
 MTB > read 'achieve.data' c1 c2 c3
 MTB > names c1='ACHSCOR'  c2='INTEL'  c3='STUDHAB'
 MTB >  plot 'ACHSCOR' 'INTEL'
 MTB >  regress 'ACHSCOR' 1 'INTEL'
Correlation Coefficient
The (sample) correlation coefficient "r" is a measure of how well the data
fits a straight line pattern. A correlation coefficient r = +/- 1.0 means
that the data lie exactly on a line (e.g. x = credit card charges,
y = account balance), r = 0.0 means there is absolutely no linear relation
(e.g. x = $/yen exchange rate, y = temperature). Correlation coefficients
in between, e.g. r = 0.5, mean that there is some linear relation plus some
noise (e.g. x = INTEL, y = ACHSCORE). Negative values correspond to a
negative slope (i.e. more in x is related to less in y) positive values
correspond to a positive slope (i.e. more in x is related to more in y).
 MTB >  corr 'ACHSCOR' 'INTEL' 'STUDHAB'

         ACHSCOR    INTEL
 INTEL     0.623
 STUDHAB   0.593    0.399
Note: The "nice" regression line at the beginning of this page was created
using S-plus.
peter@acpub
Last modified 12/1/95
