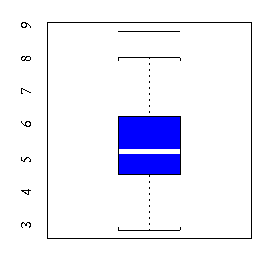
Boxplots display the main features of a batch of data. The middle half of each batch is represented by a box and the median is marked with a "+". The extent of the data and the location of possibly extraordinary values are indicated on either side of the box with special symbols. In minitab you can create boxplots with the boxplot command.
 MTB > boxplot c1


                            ---------------
              --------------I     +       I----------------     *
                            ---------------
           +---------+---------+---------+---------+---------+------C1
         2.4       3.6       4.8       6.0       7.2       8.4

 MTB >