Learn to create data sets in JMP.
Lab Procedures
JMP gives us an enormous advantage over people who learned about and performed statistical analysis back in the pre-computer days. It allows us to avoid the drudgery of long, arithmetical calculations in favor of understanding concepts and analyzing data. You may find JMP a little annoying at times (all computer software is), but I suspect that you will be thankful of its existence once we start analyzing data. JMP is also easier to work with and has more capabilities than Excel.
There should be a shortcut to JMP on the Desktop that you can click to begin JMP. If not, click on the Windows Start button in the lower left corner of the page, then select Program-Math and Statistics-JMPIN-JMPIN. The software should open with a title page showing. Click on the title page and it will disappear leaving you ready to work.
Like most Windows-based programs, there are menu choices, including File, Edit, Tables, Rows, Cols, Analyze, Graph, Tools, Window, and Help. As the semester progresses, we will learn about the options under these menu choices. For now, we focus on creating and downloading JMP data sets.
Creating new data sets
Sometimes you need to create your own data sets from scratch (e.g., when analyzing data you collected for your final project). This tutorial familiarizes you with creating JMP data sets.
Click on the New Data Table button on the JMP work window. This brings up a blank spreadsheet that will become the data set. You also can create a new data file by navigating through the menus to File - New Data Table. The first step is to tell JMP the number of rows in the data set. Click on the red arrow next to Rows, or select Rows from the menu choices, and select Add Rows. Enter the number of rows you want. To keep things simple, we'll use 9 rows for this part of the lab.
Here are the data for nine people:
Sex Number
m 1
m 2
f 1
m 3
f 2
f 2
m 3
f 1
f 2
We're going to input the nine numbers in the first column. "Column 1" is a meaningless name for a variable, so let's rename it. Double click on the box containing "Column 1" and change the variable name to "Number".
Data analysis tip: When you create data sets for your own research, give your variables descriptive labels. It is easier to interpret analysis when the output has descriptive labels than when the output has labels like "Column 1", "Column 2", "Column 3", etc. Descriptive labels also make your data set comprehensible to others who may need or want to use it. Finally, if you use the data set in future analysis, you won't have to spend lots of time trying to decipher uninformative variable names.
Let's add another column to record the sexes. Click on Cols in the menu, and select New Column. Change the name of the column to "Sex" by writing over the "Column 2". You see a button for Data Type, which allows you to specify whether the column contains numbers (numeric), labels or names (character), or row states (we won't use this). Choose character. Next is Modeling Type, which helps JMP decide what graphs to show you. The two modeling types we use are continuous and nominal. We'll learn about these in more detail later, but the basic idea is to select continuous for numbers and nominal for variables that are labels. JMP displays variables that have numbers as data with a blue "C" and variables that have labels (or names) as data with a red "N".
After you input all the data, answer the following questions. You don't have to turn in anything for this lab. Their purpose is to get you familiar with JMP.
Questions:
A) How many people picked each number?
With nine people it's straightforward to look at the data and get an accurate count. But, in the entire class of 120 people, counting the incidences of each number "by hand" would be cumbersome. In such settings, you can make life easier by sorting the numbers in increasing order, then count the incidences. Let's do this in JMP just to get familiar with this handy command.
Select the Tables menu option and click on Sort . Select the variable "Number" and place it in the By box. Hit Sort. You get a sorted data set in a new table. Sorting is useful for many data analysis. In fact, you may want to use it again later in the lab.
B) If you want to sort the data first by sex and then by number (i.e. have all the females first with numbers in increasing order and all the males second with numbers in increasing order), which sequence of commands would you use? Try them both to see what happens.
-- Select the Tables menu option and click on Sort . Select the variable "Number" and place it in the By box. Then select the variable "Sex" and place it in the By box. Hit Sort.
-- Select the Tables menu option and click on Sort . Select the variable "Sex" and place it in the By box. Then select the variable "Number" and place it in the By box. Hit Sort.
Okay, that's enough of the basics of creating your own spreadsheet. Now let's try to obtain some data sets from external sources and export them into JMP.
Earthquakes
Perhaps you have already heard that thousands of people died in a recent earthquake in Sichuan province in China. If you want to learn more about the earthquakes, you can visit the U.S. Geological Survey website to get some quantitative data. Go to the Earthquake Hazard Program here, scroll down, and download the M 1+ earthquakes in past 7 days in CSV format.
In JMP, from the menu bar, choose File -> Open, navigate to the download directory, change the file types to Text import files and pick the csv file (or maybe the txt file) you just downloaded. A table should open in your JMP window.
Question:
c) How many earthquakes around the world in past 7 days? What is the percentage of big earthquakes whose magnitude is greater than or equal to 5? How many earthquakes in Sichuan in past 7 days? What is the percentage of big earthquakes whose magnitude is greater than or equal to 5?
HINT: After you import the data into JMP, check the Rows panel on the lower left corner in JMP. It shows the total number of rows. Go to Rows, Row selection, Select Where (Ctrl + Shift + W), select Magnitude, and then is greater than or equal to, then type 5 in the right box, click add condition. Then you can check how many rows are selected in the rows panel. Similarly, add condition Region contains sichuan selects the earthquakes in Sichuan. You can add two conditions, which selects big earthquakes in Sichuan.
By the time I checked on May 13, there are 52 big earthquakes (4.2 %) in past 7 days (1241 earthquakes reported). But 25 (62.5 %) out of 40 earthquakes in Sichuan are greater or equal to magnitude of 5.
Explore the stocks
Suppose we would like to look at a particular stock, for example, XOM (Exxon Mobil corporation), or your favorite stock. The first thing to do is to obtain the data, say the weekly price for the most recent 5 years. We would like to download the data and import it into JMP. Go to Google Finance, search for the stock. Click on the Historical Prices just above the fancy graph. Select weekly instead of daily, change the date range from 2003 to 2008, click update button, and then download the spreadsheet (a .csv file) on your computer.
In JMP, from the menu bar, choose File -> Open, navigate to the download directory, change the file types to Text import files and pick the csv file you just downloaded. A table should open in your JMP window.
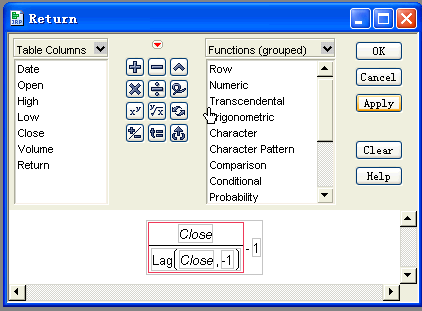
Now let's create a return column. Click column red button, and choose New Column in the drop down list. Write "Return" as your column name. Click Column Properties button and select formula in the drop down list. Since return is today's closing price divided by yesterday's closing price minus 1 (note, there are other ways to define the return, but we shall stick to this particular definition for now), we just need to write a formula like follows.
Here is another question. Since we haven't cover distribution in class yet, your answer could be descriptive, for example, are they symmetric, or skewed?
Question:
d) What are the distributions look like for Close and Return? Which one is more like a "regular bell shape"?
Click Analyze -> Distribution, then put Close, Return in Y, Columns, and click OK. You will get a chance to look at the histograms, box plots, and quartiles and moments for these variables. You will learn more about them this week.
This ends the lab. Since this is the first lab, and we haven't cover much statistics yet, you do not need to turn in anything. However, from next time on, you are required to turn in your lab report at the end to of lab.
DON'T FORGET TO LOG OFF FROM YOUR MACHINE.