Clustered Dirichlet Process Mixture Modelling


CDP home Downloads Inputs Outputs Examples

Examples: Here you will find two sample data sets, the necessary parameter files, and several R scripts for generating useful summaries based on the model output.

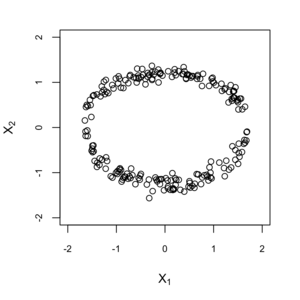
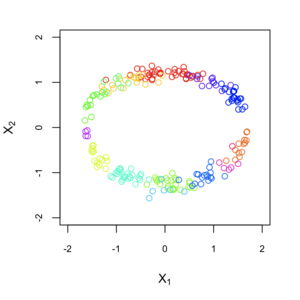
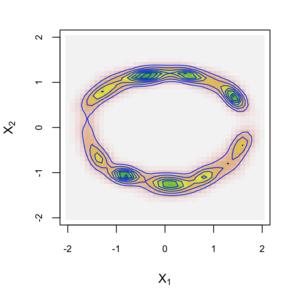
The plotting scripts require the ability to sample from and evaluate multivariate normal and T distributions, and to perform gradient ascent on a discretized space. In order to run the plotting scripts as provided here, you will need the myrand R package. Technically it is not an R package yet, but once loaded it behaves as one.

To install myrand you will need to download and uncompress the source code above, and compile the R package. From a command prompt, go into the myrand/src directory, and issue the command "R CMD SHLIB -o myrand.so *.c". On a Windows machine with the RTools software installed, issue the command "R CMD SHLIB -o myrand.dll *.c".

Circle Data (standard DP mixture)
This example demonstrates how to use the software to fit a standard DP mixture model.

Files:

  • x.txt: Data file consisting of 228 bivariate observations, simulated from 8 normal distributions.
  • parameters.txt: Parameter file for fitting a standard DP mixture of normals to the circle data.

    Note: Here J=1, meaning that the top-level mixture has only one component, and therefore the model essentially collapses to a standard DP mixture of normals.

  • load.r: R script for loading the output of this analysis.
  • plots.r: R script for producing various plots based on the data and the sampled parameter values, including the plots above. You will need to change the top few lines to reflect the proper path to these files on your system.

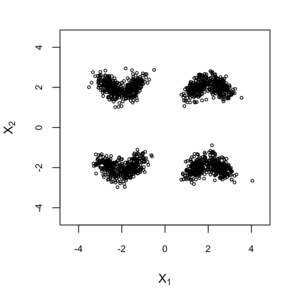
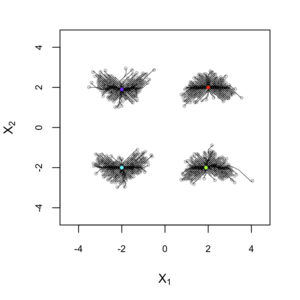
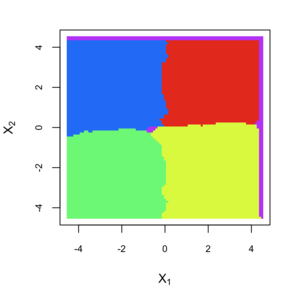
Cluster Data (mixture of mixtures)
This example demonstrates how to use the software to fit a 2-layer mixture of mixtures model.

Files:

  • x.txt: Data file consisting of 1600 bivariate observations, simulated from 8 normal distributions.
  • parameters.txt: Parameter file for fitting the 2-layer mixture of mixtures model to the cluster data.
  • load.r: R script for loading the output of this analysis.
  • plots.r: R script for producing various plots based on the data and the sampled parameter values, including the plots above. You will need to change the top few lines to reflect the proper path to these files on your system.

CDP code developed by: Dan Merl & Quanli Wang

More software from the West group