2.2 Two-Sample Data

Two sets of independent samples x1,...,xn and y1,..., ym, representing two different treatments X and Y. The objective is to compare the effects of the two treatments.

Here is an example for two-sample data:

   Active Exercise         Passive Exercise
   Group                   Group
   -----------------------------------------
    9.00                    11.00
    9.50                    10.00
    9.75                    10.00
   10.00                    11.75
   13.00                    10.50
    9.50                    15.00
   -----------------------------------------
The data gives the ages, in months, when children first walked by themselves. One group of children went throuh an ``active exercise'' program. The other group went through a ``passive'' program.
Appropriate descriptive statistics are, for example, computing mean, median and standard deviation for each of the two samples. This can be done using the describe command in Minitab:
 MTB >  read 'babies.data' c1 c2
 MTB > describe c1 c2
 
                 N     MEAN   MEDIAN   STDEV  
 ACHSCOR         6   10.125    9.625   1.447  
 INTEL           6   11.375   10.750   1.896  
Possible graphical summaries are:

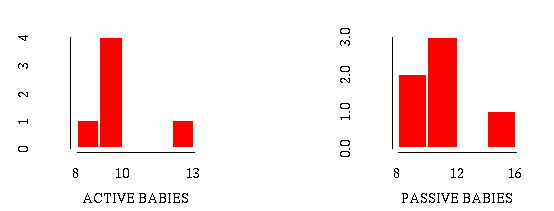
histograms:

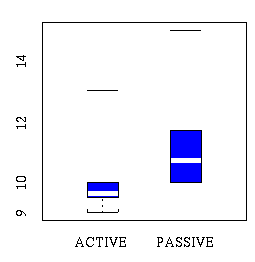
or boxplots: